ANALYTICS WEEK: COMPLETION PERCENTAGE AND THE IMPORTANCE OF FILM
Hello, friends — welcome to Analytics Week. For five of our 100 Days to Kickoff, FTRS is bringing you college football analytics content, powered by our friends at cfbfastR, nflfastR, and Statsbomb.
Thus far this week, we’ve unpacked expected points, focusing on the “what”, the “how”, and the “why” of the concept. We’ve mused on the concept of statistical luck, and why teams that win on underlying numbers don’t win actual games. As we’ve established, the point of analytics work is (simply put): figuring out how to win games sustainably. What things are “good” things? How can we do “good” things more often? These are questions that a computer can identify given a little human prodding and a large descriptive dataset about the game. We’re focused on finding these deeper truths about how to win and how we can implement them, but we’re taking a more efficient route to get there than having an army of analysts manually watching play after play.
But there is an inherent value to having knowledge derived from film study. Thus far, we’ve built our models off play-by-play data, where we get situational context at the time of the snap (down, distance, yard-line, etc.) and a short description of the outcome of the play. This is a lot of information, especially at the scale we’ve used it at thus far (~1.2M plays, ~7000 games, 10 seasons), but in truth, it’s incomplete: we only get a start state and an end state. In essence, our data looks much like this:
The film makes up the middle: we know what happened, but to do deeper analysis, we need to understand how it happened. Why might we want to do this at the play level? Why not stay at the game level in our analysis?
Let’s double back to our “why” of expected points:
- If you create more expected points, you increase your odds of scoring next in the half.
- Scoring next in the half more often (IE: scoring more often) leads to more points.
- More points lead to more wins.
The obvious question is then: if we can draw a straight line from expected points to wins, how do we create more expected points? If we say that any gain of expected points on a play is an in-game “win”, how do we win on every play?
This last part sounds like coach-speak, right? That’s not a coincidence; that’s also what coaching analysts are looking for in the film:
- When we “won” a play, what went right and why did it go right?
- When we “lost” a play, what went wrong and why did it go wrong?
But as data analysts, we can’t figure out the answers to these same questions without knowledge of that “missing middle” of a play. How do we get there?
Statsbomb has done some pioneering work in this regard. The fine folks in their American football division have gone one step further than “teaching” a computer to recognize trends in play-by-play data like we have done with our expected points models: they’ve gotten a computer to “watch” games and automatically tag a great-many more things on a single play than what we’re able to determine from the play-by-play. This increased information density can help us (and a computer) learn more things about the game by taking advantage of visibility into a play’s “missing middle”. Let’s take this data for a spin today by evaluating pass attempts. Passing plays often go for chunk yardage/EPA, and it’s often very easy to determine “win” or “loss” on a passing play: was the pass complete or not? However, former Wisconsin quarterback / current CFB media personality Nate Tice raises a really good point about this kind of simple analysis:
Nate hits on something very devilish about the concept of completion percentage: it treats every pass as the same.
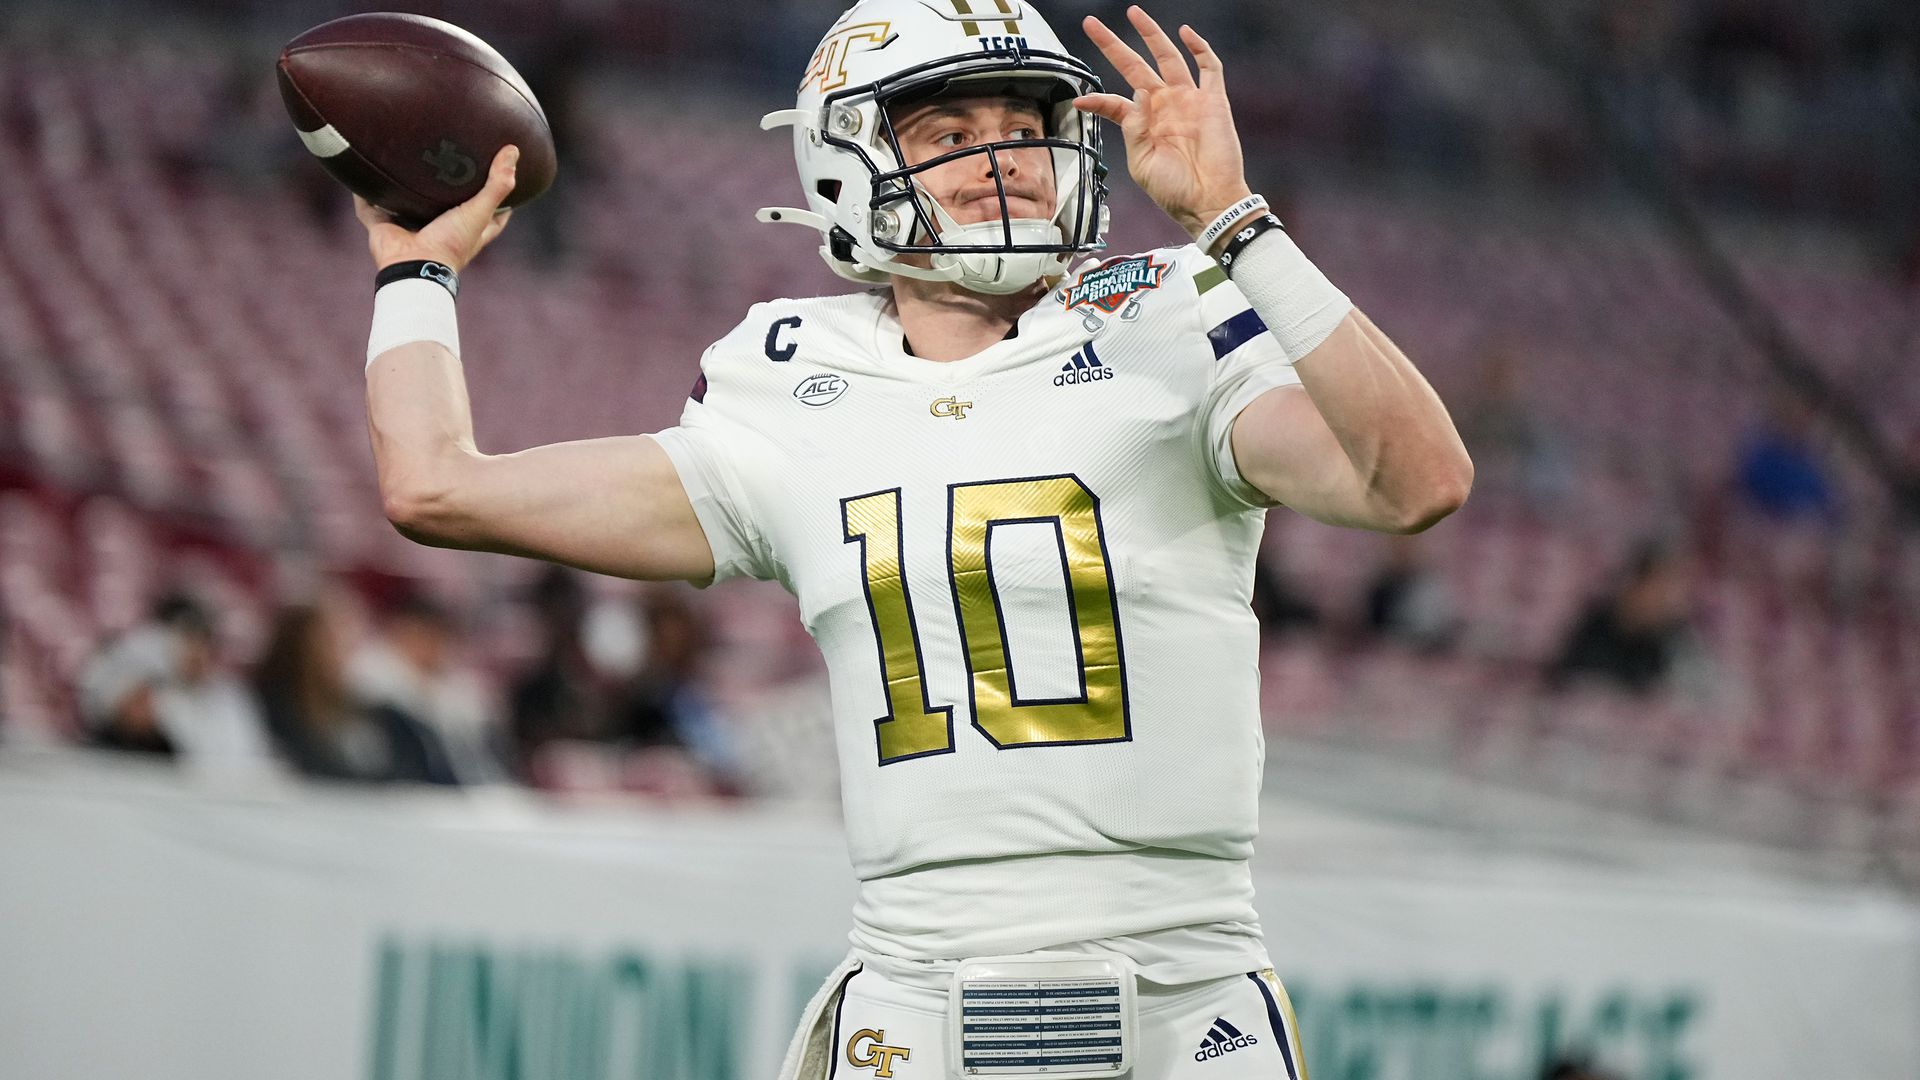
Take a look at these two Haynes King throws:
The first: an unpressured short checkdown to an unguarded Malik Rutherford with room to run. If King doesn’t hit that, you’re probably annoyed — frustrated, even. “He’s wide open! How can you not make that throw?”
The second: with pressure coming, a high long fade into the corner of the endzone where Dominick Blaylock is surrounded by four defenders, with two tight to him. When Blaylock goes up for this one and hauls it in, you’re ecstatic — both because Tech has scored AND King has fit this ball into a fairly tight window!
But simple completion percentage counts both of these throws the same: both as one completion and one throw each. Obviously, this is true; in literal terms, they are both passes that are completed, but were these two throws really the same? We can see that one throw was far easier than the other, so wouldn’t it make sense if completion percentage could differentiate between the two? Put another way like Nate suggested, can we add context to completion percentage by quantifying how difficult a throw was to make?
This is this basic principle behind expected completion models: we want to define how difficult a pass attempt was to complete based on its situational factors. Much like yesterday, let’s start with an exercise: what makes a pass hard to complete? Take a couple minutes to think about this; I’ll wait.
Let’s go back to our examples:
- An unpressured short checkdown to an unguarded Malik Rutherford with room to run.
- With pressure coming, high long fade into the corner of the endzone where Dominick Blaylock is surrounded by four defenders, with two tight to him
What makes the first easier than the second?
- The pass travels a shorter distance.
- The receiver is unguarded, rather than being surrounded by defenders.
- The receiver gets the ball in space in-bounds, rather than being near the corner of the endzone.
- The quarterback is not under any pressure, rather than the pocket beginning to stretch and collapse around him.
Once again, you’ve built an expected completion model. Much like with expected points, based on our lived experience, we’ve constructed this intuitive understanding of what leads to a complete pass, involving four components:
- Air Yards: the straight-line distance traveled by the throw
- Separation: the proximity of defenders to the receiver
- Space: the proximity of the receiver to the sideline or back of the endzone
- Pressure: the proximity of defenders to the quarterback
In our heads, we combine these factors to get a probability that the pass will be completed. Given the data Statsbomb provides, we can make a computer follow that exact same process and spit out a more robust assessment.
The Statsbomb open dataset we have to play around with contains 8,079 valid pass plays over 108 NFL games with a few columns relevant to our inputs:
- Air Yards: event_pass_air_yards
- Separation: play_target_separation
- Space: event_pass_target_x, event_pass_target_y
- Pressure: play_qb_pressure
Our output is (obviously) the completion status of the throw.
One challenge we need to solve: Statsbomb’s standard coordinate grid standardizes the direction of play for both teams (regardless of quarter) to be left to right, so our event_pass_target_x and event_pass_target_y values are indexed from the front-left corner of the offense’s endzone as shown:
Semantically, they represent the receiver’s location at the time of the throw from the offense’s goal-line and the left sideline, but for the purposes of our model, we’d like to know the distance the receiver is from the back of the defense’s endzone and either sideline, since these locations determine the limits of the playing area and a pass completed out of bounds is technically incomplete. Thus, we need to re-base our X and Y values around these locations to properly use these values in our model. Here’s how we did that:
Let’s validate our model by binning these throws by air yards distance:
- Short: <5 air yards
- Intermediate: 5 to 15 air yards
- Deep: 15+ air yards
Then, we’ll apply the LOSO fitting as earlier this week and check the calibration of our model by building another calibration plot:
Our plots are certainly funny-looking, but our calibration error is 0.004, close to the calibration error of the nflfastR expected completion model (which is industry-standard) of 0.005.
With our model in hand, let’s go back to our two example throws:
- An unpressured short checkdown to an unguarded Malik Rutherford with room to run.
- With pressure coming, high long fade into the corner of the endzone where Dominick Blaylock is surrounded by four defenders, with two tight to him
Here’s how these two look plotted on Statsbomb’s coordinate grid (I’ve tagged and roughly estimated values for these):
And here’s how we’d represent these throws for input into the model:
Now, let’s throw our examples into the model:
These make sense, right? Our brains tell us that one was far easier than the other based on the passes we’ve seen historically — the model just reinforces that natural understanding with a percentage. Additionally, in much the same way with expected points, we can aggregate these expected completions and compare them to actual completions to compare quarterback performance while accounting for context. We can generate an expected completion percentage by dividing expected completions by the number of actual pass attempts, then subtract the quarterback’s actual completion percentage from the expected completion percentage to get completion percentage over expected (commonly referred to as CPOE), which tells us how well a quarterback is executing on their throws, accounting for their difficulty, compared to the average quarterback. With an expected completion model and CPOE, we’re accounting for the major weakness of completion percentage that Nate touched on in his tweet: not all passes are equal, and we shouldn’t treat them as such when evaluating quarterback performance.
Another packed day! Let’s recap:
- Watching film and “doing analytics” are not mutually exclusive concepts; both activities are meant to reveal deeper truths about the game.
- Play-by-play data gives analysts the start and end states of a play (the “what”), but not what happened between them: the “how”. Film analysis fills in this “missing middle”.
- Statsbomb makes a computer “watch” the tape to automatically tag people, places, and things to fill in a play’s “missing middle”.
- Using the tags that Statsbomb applies to plays, we designed, built, and validated an expected completion model to quantify the difficulty of pass attempts.
- With this model in hand, we contextualized two example pass attempts from the 2023 Georgia Tech football season in terms of their inherent difficulty.
To tie this all back to the common goal of “analytics” (generating more wins), we know a quarterback’s decision to target a receiver is fundamentally risk versus reward — IE: “if I can fit this ball into this tiny window between three defenders, we’re going to score”. Our new tools of expected completion percentage and expected points map onto these decision-making factors very neatly; we’re able to quantify both risk and reward and determine where the optimal point is at which one outweighs the other. We can then take that information and use it to inform how a quarterback makes his reads or how an offense schemes its receivers open on a particular play. Making these kinds of changes at the play-level can have a snowball effect on team performance: better decisions on the football field may lead to more expected points, and as we know, if we can increase expected points, we can increase the chance of actual points, which increases the chance of wins.
On the way out, there are two caveats I should mention about the model we built today:
- The plays in our dataset are from the NFL, which is (obviously) a fundamentally different football environment than college. An 80% completion probability throw in the NFL might not be 80% in college; the quality of player found in CFB is far too variable, both across FBS and throughout a roster.
- These plays are also from one player’s team-seasons, which biases our sample. Our model is “learning” from this player and the few quarterbacks he faces, rather than learning from all quarterbacks.
Despite these weaknesses, building this “toy” model still has value: if you remove the technology and the math, there’s nothing scary about “advanced stats”! Fundamentally, we inherently understand these concepts as parts of the game; they’re things we can see and feel. The only thing a computer is doing is quantifying those feelings.
Thanks again to Statsbomb for providing data for us to explore and build public models with. Learn more about their American football research at https://statsbomb.com/articles/football/.
2024-07-04T12:13:56Z dg43tfdfdgfd