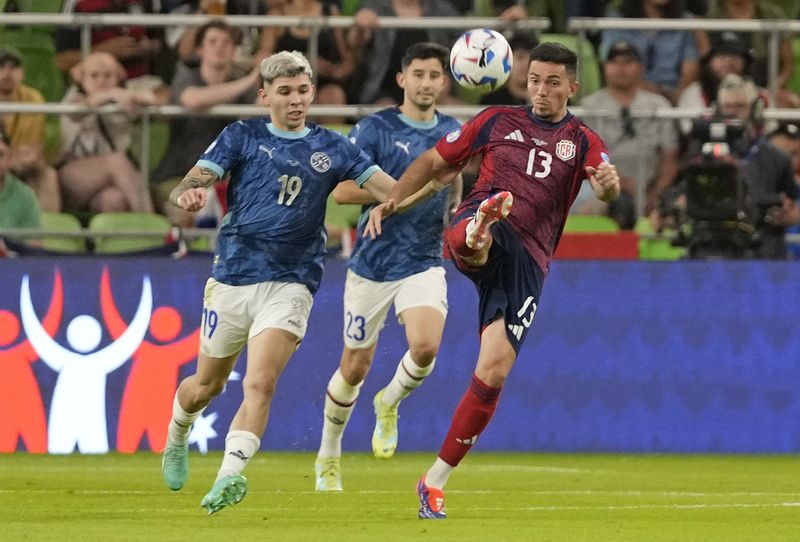
THE NUMBERS NARRATIVE: USA 0-1 URUGUAY
The match statistics reflect a balanced encounter, with both teams holding 50% possession. However, Uruguay created the more dangerous opportunities, with two big chances compared to none for the USA. The Expected Goals (xG) metric also favored Uruguay, who posted an xG of 1.4 compared to the USA’s 0.56, highlighting their superior quality in chance creation.
Federico Valverde was a standout performer for Uruguay, receiving 47 passes and completing 43 out of 53. His 19 progressive passes were crucial in driving Uruguay forward. Matías Viña also contributed significantly with nine progressive carries, continually pushing Uruguay into the attacking third.
Defensively, Uruguay showed their mettle, winning more ground duels (39 to USA’s 34) and aerial duels (17 to USA’s 14). Nahitan Nández led the defensive effort with four tackles, ensuring that the USA found it difficult to break through Uruguay’s solid backline.
Despite the USA’s higher field tilt of 57.56% compared to Uruguay’s 42.44%, they struggled to convert their territorial advantage into clear-cut chances. Uruguay’s pressing game was more effective, as indicated by their lower Passes per Defensive Action (PPDA) of 5.38 compared to the USA’s 10.00, disrupting the USA’s build-up play more efficiently.
Their five shots on target further emphasized Uruguay’s ability to create and capitalize on their chances compared to the USA’s three. Giovanni Reyna, the highest Expected Threat (xT) player for the USA with 0.15, couldn’t find the breakthrough needed to alter the game’s outcome.
In conclusion, Uruguay’s tactical discipline and clinical finishing secured a narrow victory over the USA. The match was a testament to Uruguay’s ability to capitalize on key moments and maintain defensive solidity, ensuring they emerged victorious in a closely fought battle.
2024-07-02T05:04:46Z dg43tfdfdgfd